
📣 Gato GraphQL v13.0: Enhanced Logging & Troubleshooting
We're excited to announce the release of Gato GraphQL v13.0, bringing powerful new logging capabilities and improved troubleshooting features.
This release adds a screen to visualize the logs, and a notification badge in the WordPress admin menu when a new log entry is created, making it easier to identify and fix issues.
This is particularly useful to monitor GraphQL operations executed via:
- The Internal GraphQL Server extension
- The Automation extension
Severity Levels
We've implemented a 4-level severity system to help you quickly identify issues:
- 🔴 Error: Critical issues that prevent operation completion
- 🟡 Warning: Non-critical issues that may affect the operation
- 🔵 Info: General operation information
- 🟢 Debug: Detailed debugging information
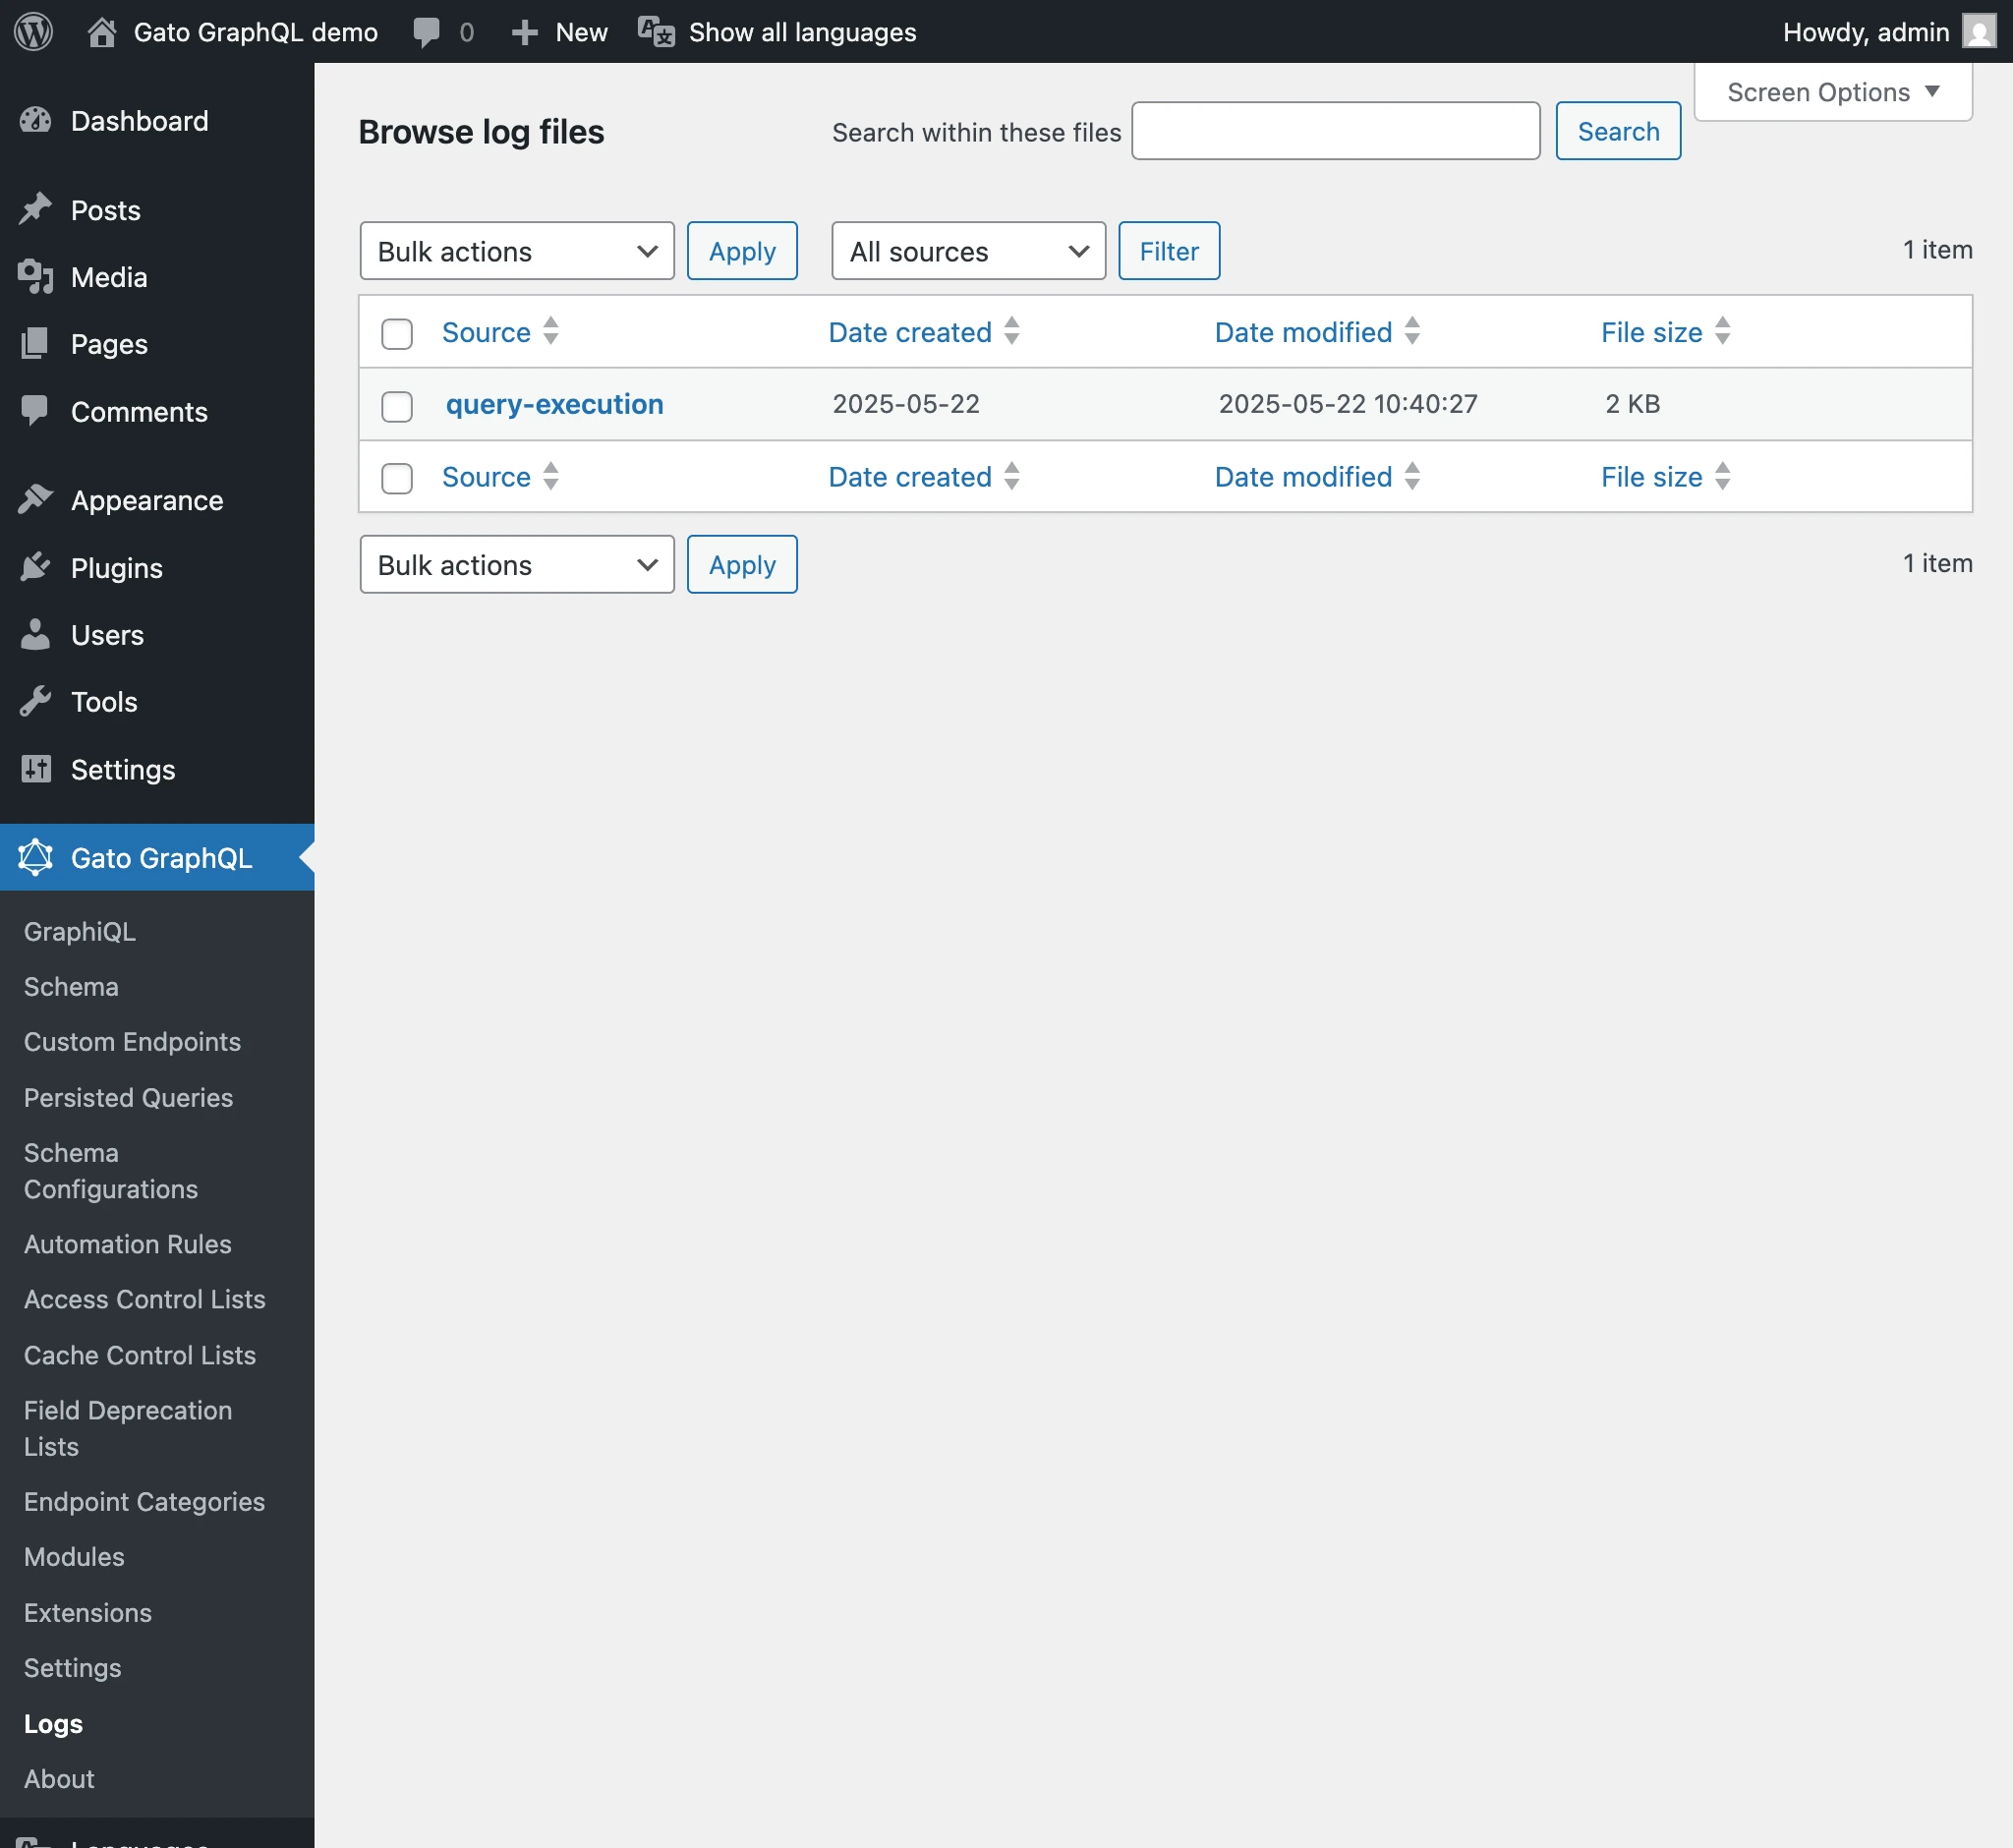
Logs Visualizer
Browse your logs directly from the WordPress admin:
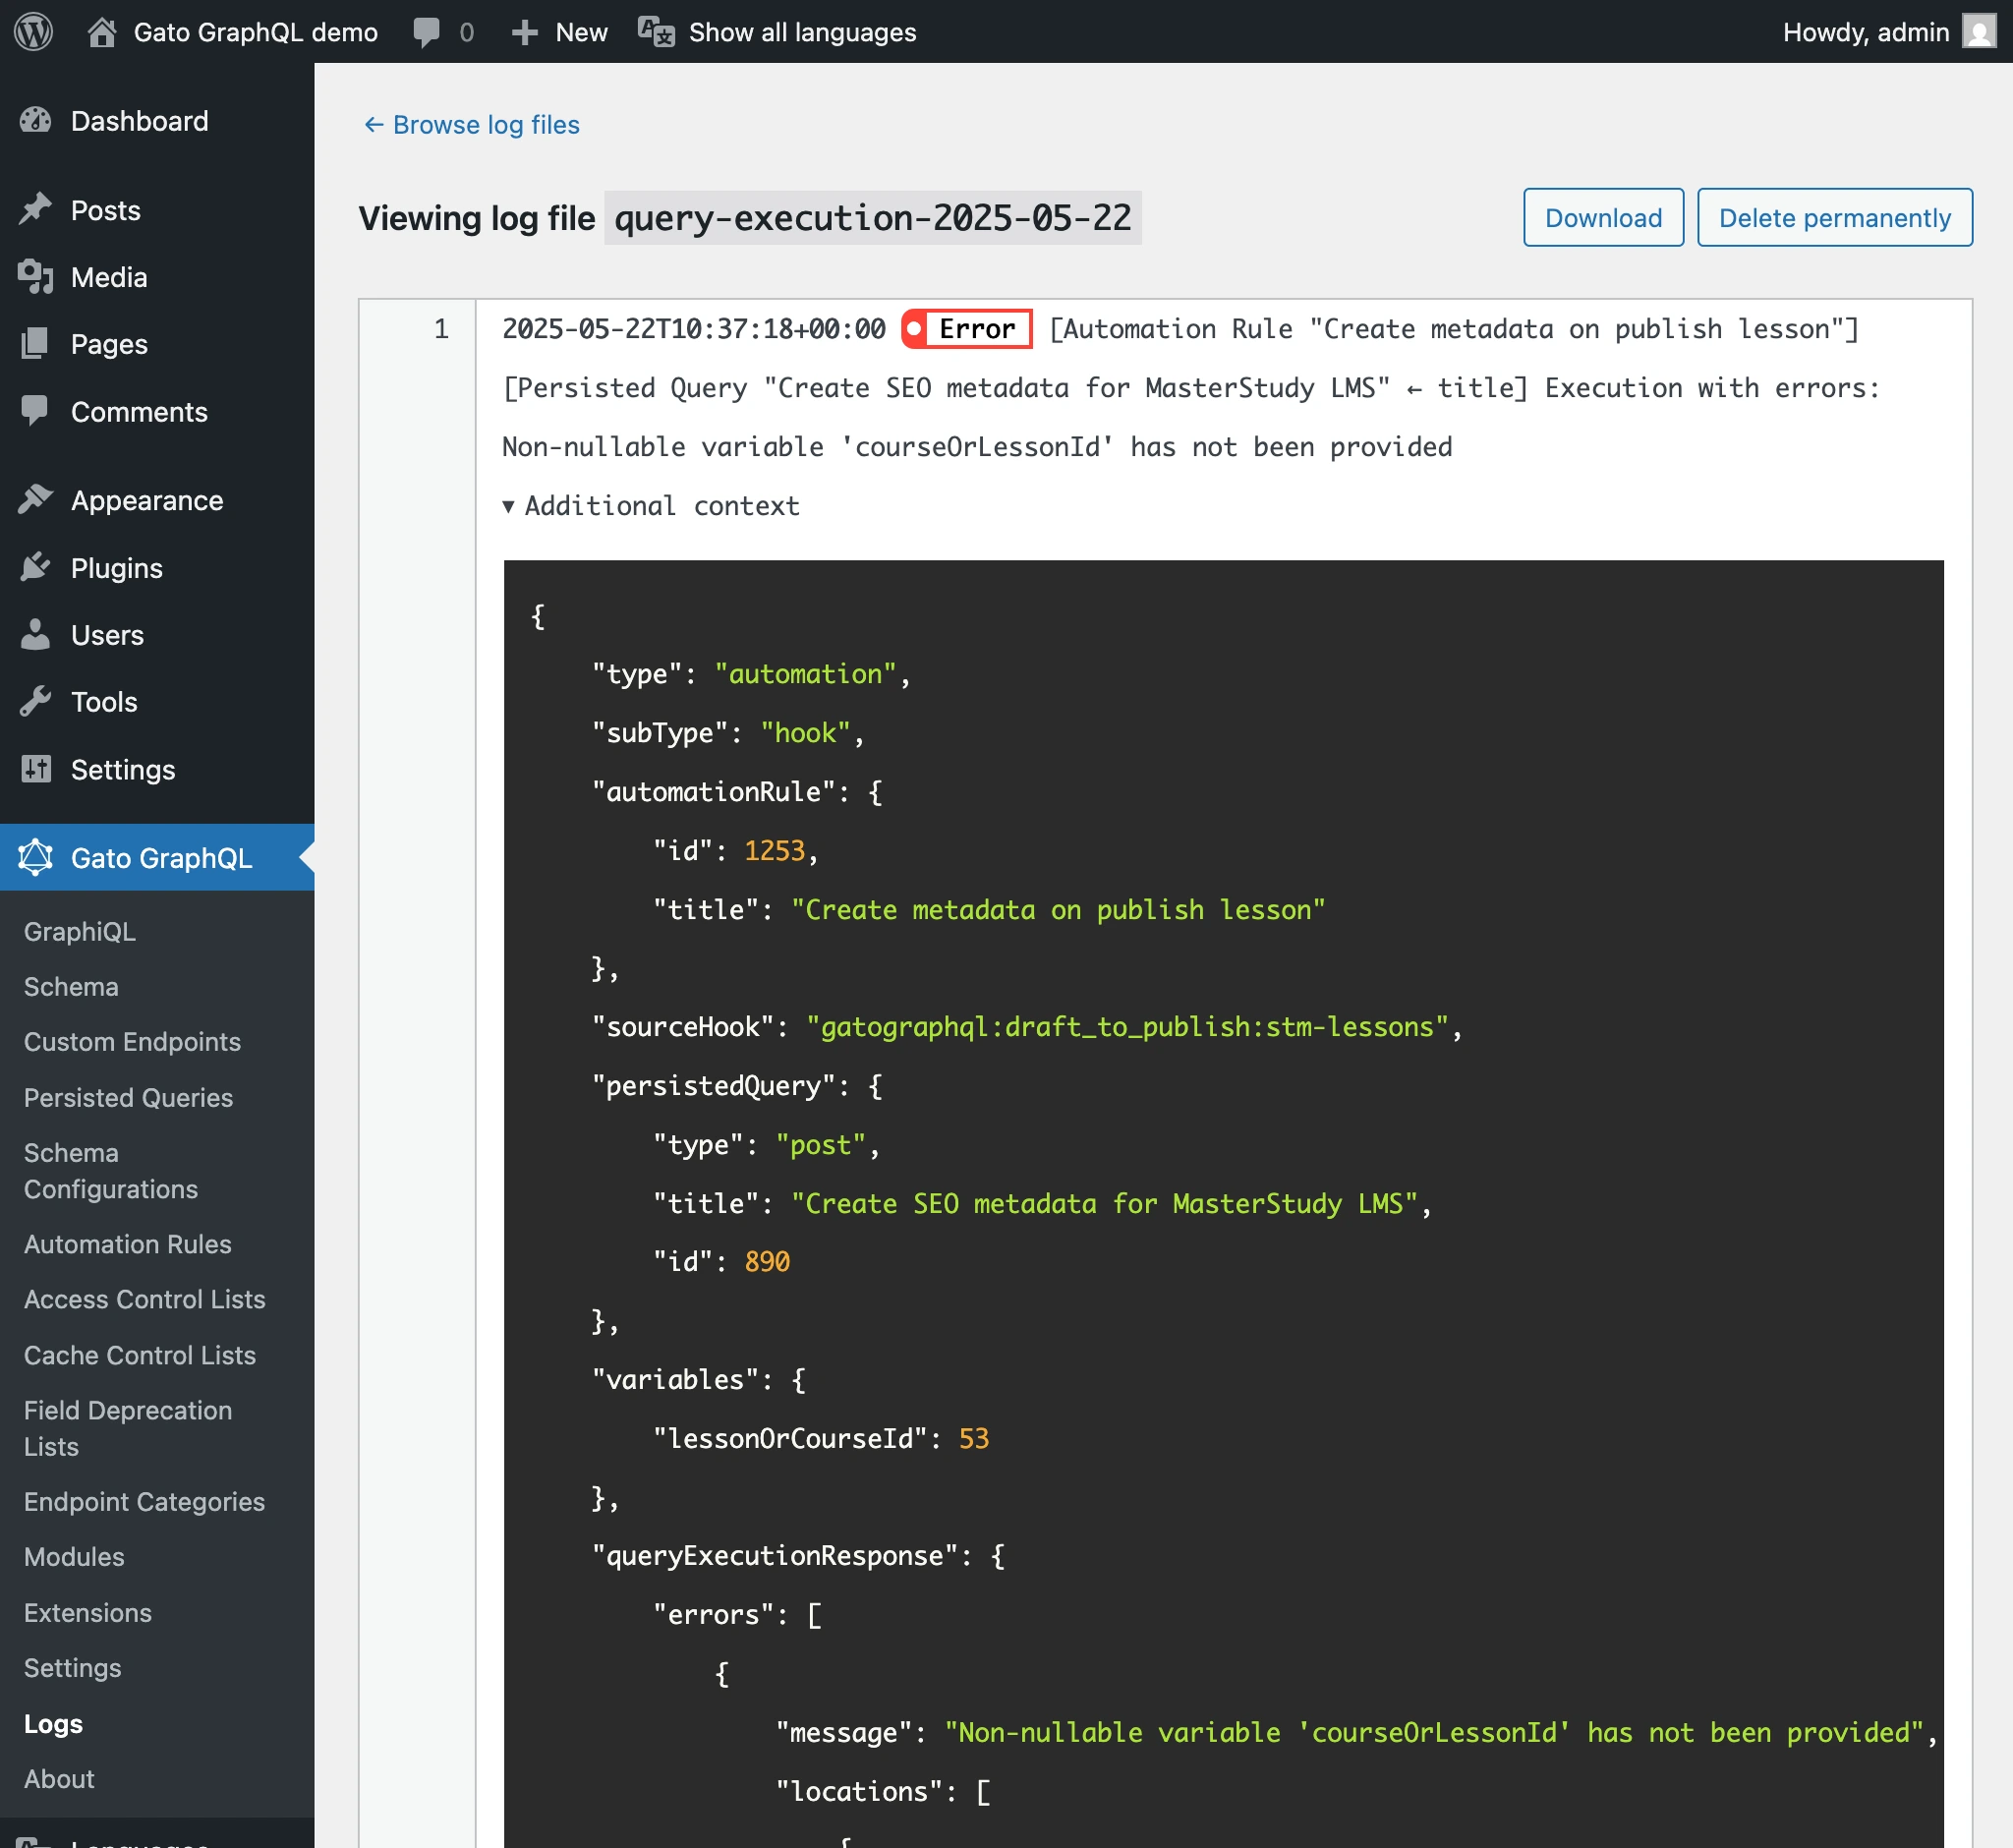
The log entry will show you exactly what's wrong:
Notifications
The plugin now shows notification badges in the WordPress admin menu when a new entry is created for the selected log severities:
This is the plugin telling us that an operation has failed or produced a warning, and we can fix it.
Settings
You can customize the logging behavior under Settings > Plugin Configuration > Logs:
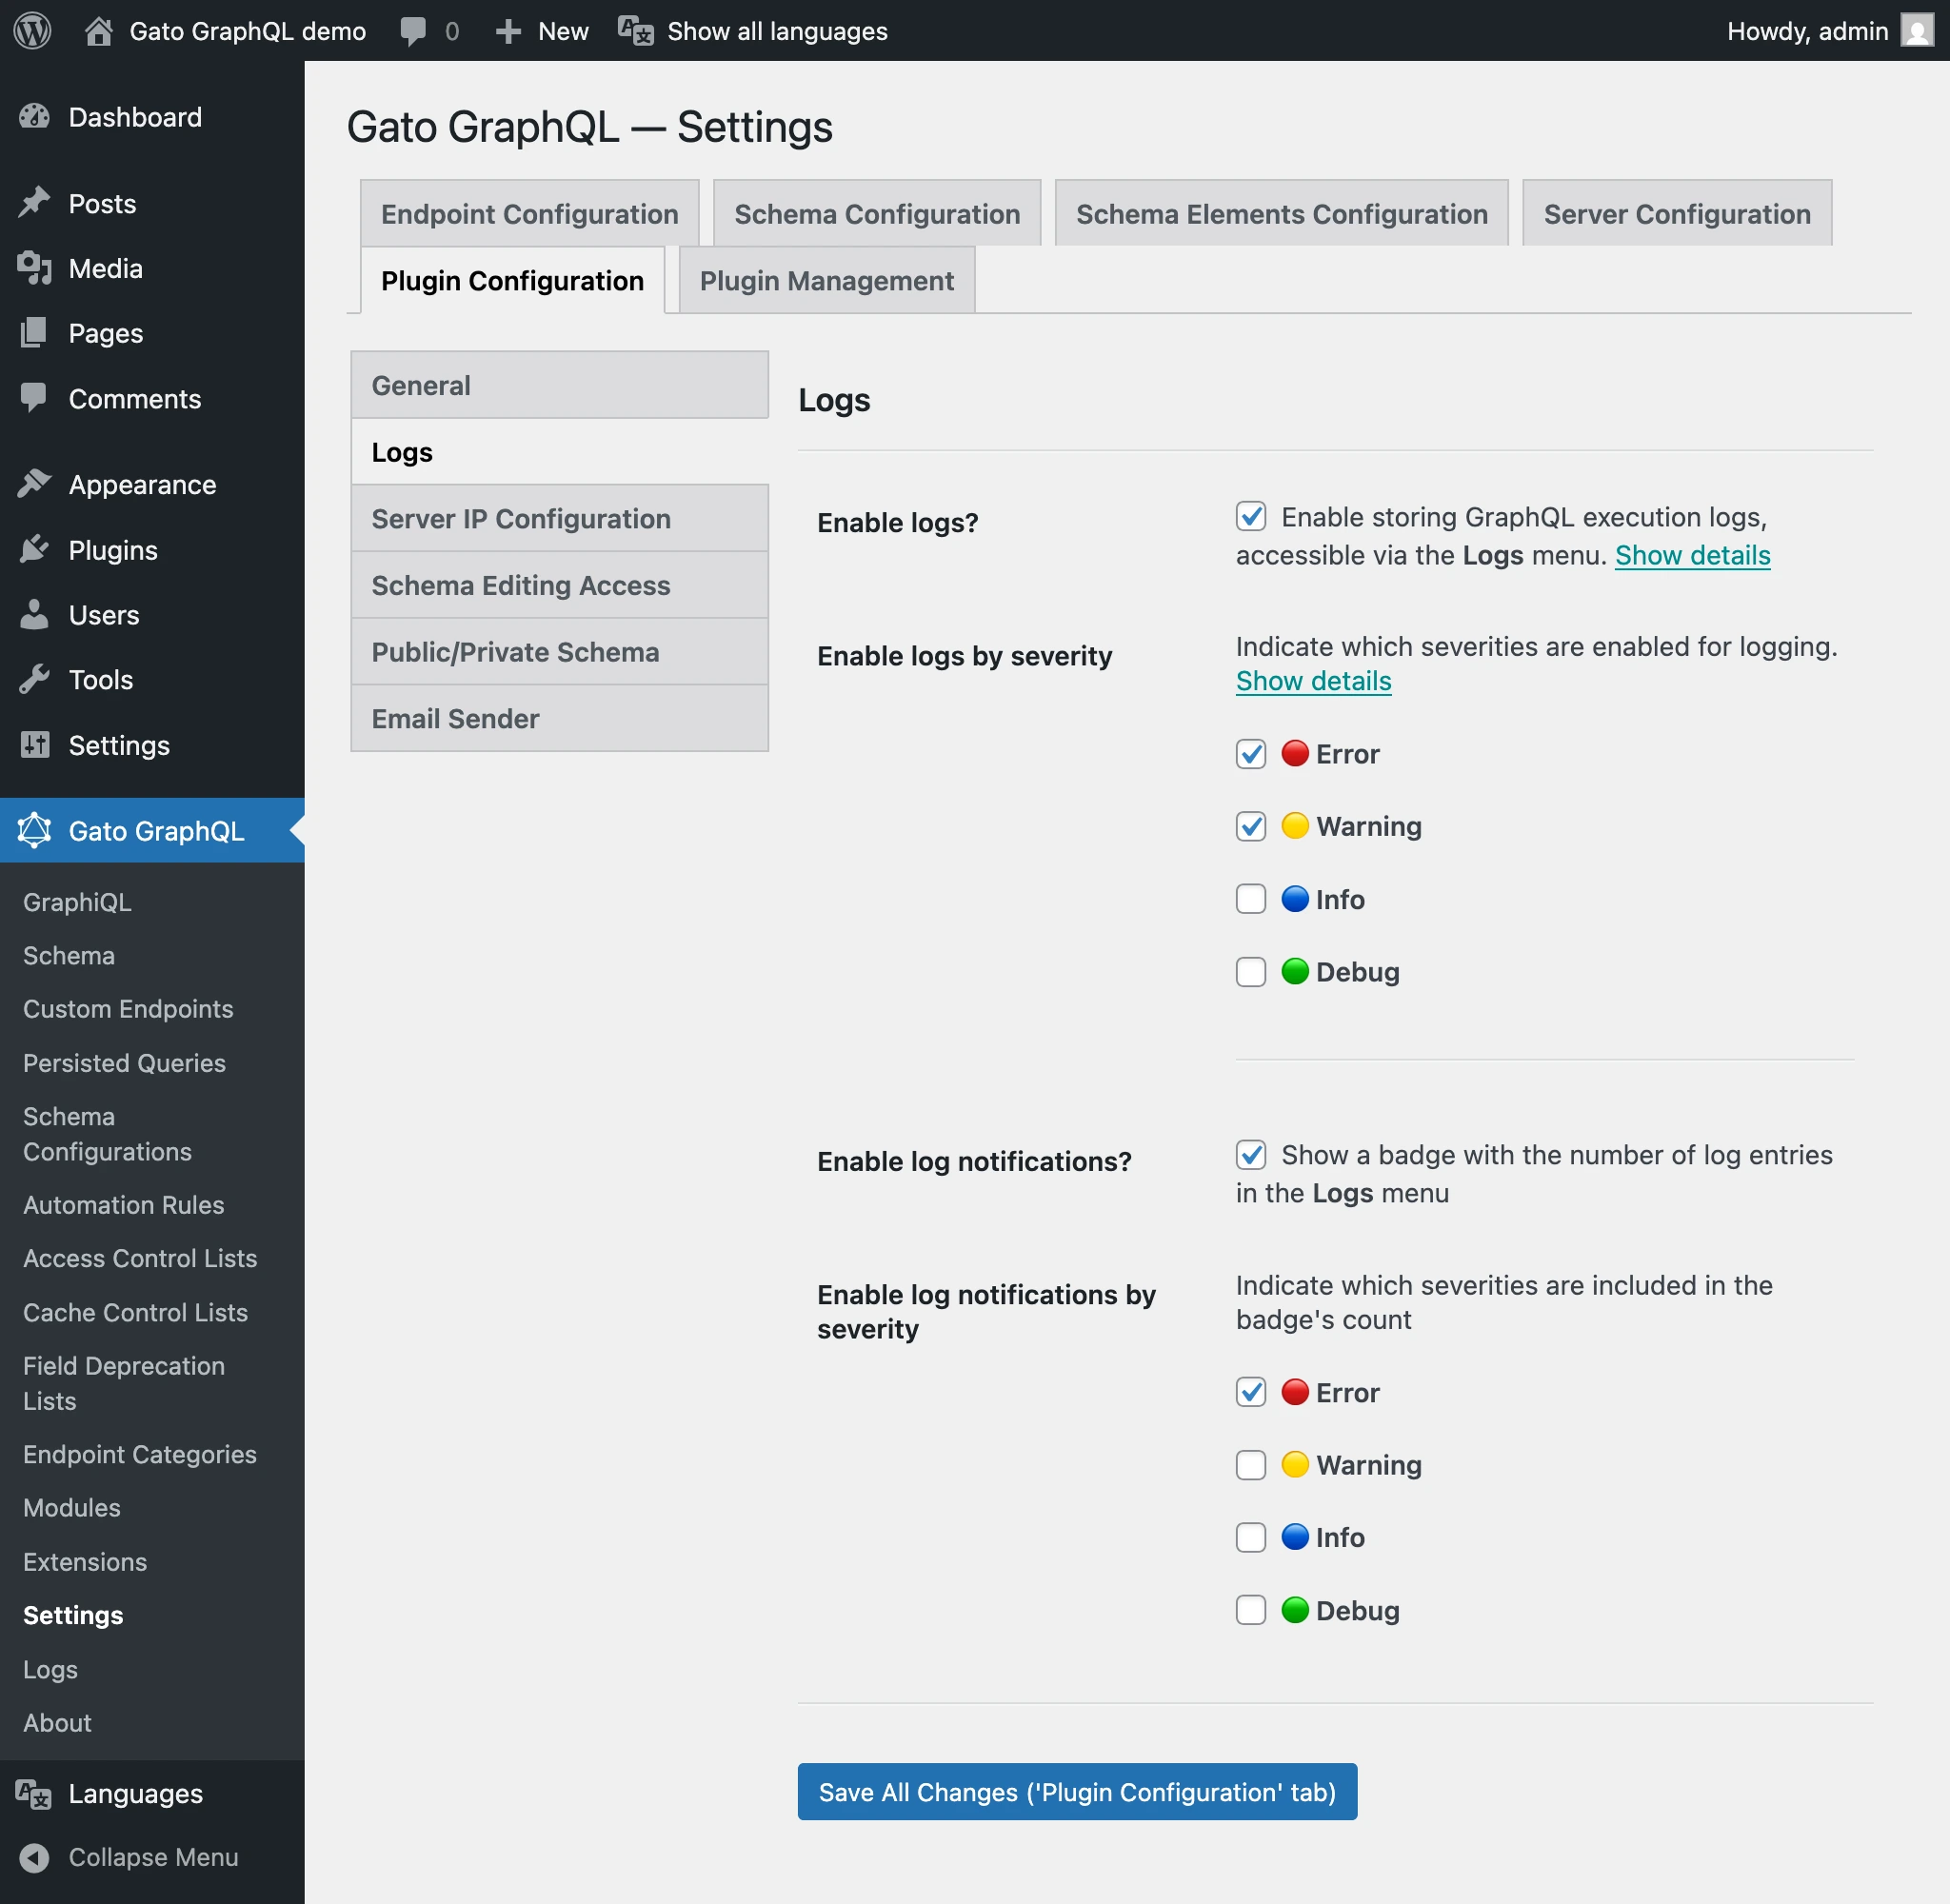
- Enable/disable logging and notifications
- Choose which severity levels to log
- Configure which severities trigger notifications
These new features will hopefully enhance your use of Gato GraphQL. Try it out and let us know what you think!